


Market Structure Basics: How the Market Really Moves
By Ougbenga Mewoyeka
Market structure is one of the most important—and most misunderstood—concepts in trading. Before indicators, before strategies, before entries and exits, price structure is the foundation of every market movement.
If you cannot read market structure, you are reacting blindly to price. If you understand it, the market stops feeling random.
This guide breaks down market structure basics in a simple, professional, and psychology-first way so you can understand how price actually moves across Forex, Crypto, Indices, and Commodities.
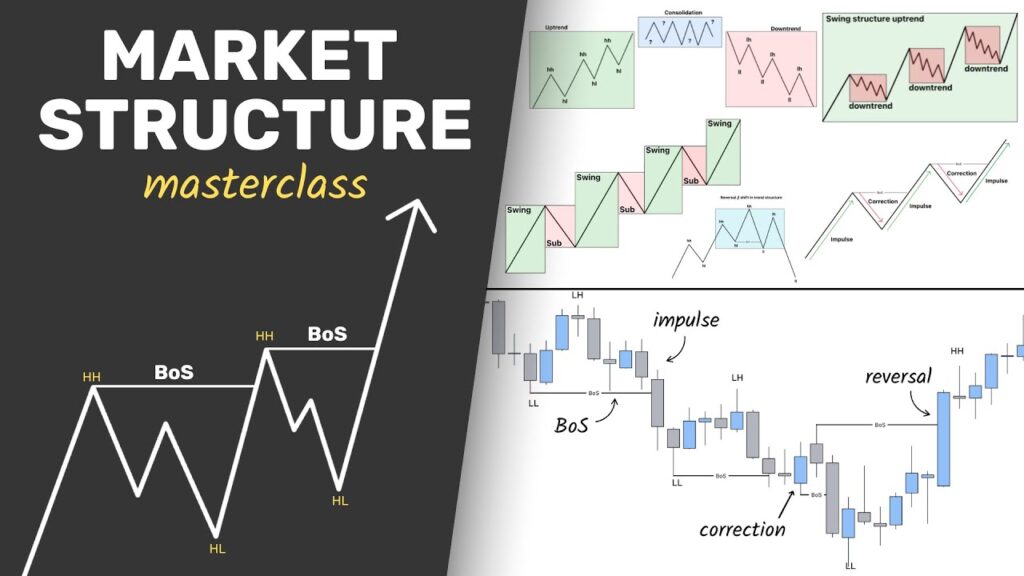
What Is Market Structure?
Market structure refers to the sequence of price movements on a chart—how price creates highs and lows over time. These movements tell you whether the market is:
-
Trending upward
-
Trending downward
-
Or moving sideways (consolidating)
At its core, market structure answers one critical question:
Who is in control right now—buyers or sellers?
Professional traders don’t predict price. They observe structure and align with it.
Why Market Structure Matters
Most traders lose because they trade against structure.
They buy because price looks “cheap.”
They sell because price looks “high.”
The market does not care about cheap or expensive, it only respects trend and liquidity.
Understanding market structure allows you to:
-
Trade in the direction of momentum
-
Avoid low-probability countertrend trades
-
Time entries with confidence
-
Control emotions by following logic, not impulse
The Three Market Conditions
All financial markets operate in only three conditions:
1. Uptrend (Bullish Market)
An uptrend is defined by:
-
Higher Highs (HH)
-
Higher Lows (HL)
This means buyers are consistently willing to pay higher prices.
Psychology: Confidence dominates fear. Buyers are in control.
2. Downtrend (Bearish Market)
A downtrend is defined by:
-
Lower Lows (LL)
-
Lower Highs (LH)
This means sellers are aggressively pushing price lower.
Psychology: Fear dominates confidence. Sellers control the market.
3. Range (Consolidation)
A ranging market moves sideways, creating:
-
Equal highs
-
Equal lows
Neither buyers nor sellers have full control.
Psychology: Indecision. Smart money waits for liquidity before expansion.
Understanding Highs and Lows
Everything in market structure comes back to highs and lows.
Higher High (HH)
Occurs when price breaks above a previous high.
Meaning: Buyers are strong.
Higher Low (HL)
Occurs when price pulls back but holds above the previous low.
Meaning: Buyers are defending price.
Lower Low (LL)
Occurs when price breaks below a previous low.
Meaning: Sellers are strong.
Lower High (LH)
Occurs when price retraces but fails to break the previous high.
Meaning: Sellers are defending price.
Trend Identification Using Market Structure
To identify trend direction:
-
Uptrend = HH + HL
-
Downtrend = LL + LH
-
Range = No clear HH or LL
Ignore indicators at this stage. Price alone tells the truth.
Break of Structure (BOS)
A Break of Structure occurs when price breaks a key high or low in the direction of the current trend.
Bullish BOS
-
Price breaks above a previous high in an uptrend
Bearish BOS
-
Price breaks below a previous low in a downtrend
Meaning: Trend continuation.
Professional traders use BOS to:
-
Confirm momentum
-
Hold trades longer
-
Avoid premature exits
Change of Character (CHOCH)
A Change of Character signals a potential trend reversal.
Bullish CHOCH
-
Price breaks a lower high in a downtrend
Bearish CHOCH
-
Price breaks a higher low in an uptrend
Meaning: Control may be shifting.
CHOCH does not guarantee reversal—but it warns you to stop trading blindly in the old direction.
Structure on Multiple Timeframes
Market structure exists on all timeframes.
-
Higher timeframes = Direction
-
Lower timeframes = Entry precision
Example:
-
Daily chart shows bullish structure
-
15-minute chart provides pullback entries
Ignoring higher timeframe structure is one of the fastest ways to overtrade.
Market Structure and Liquidity
Markets move to:
-
Create liquidity
-
Take liquidity
-
Rebalance price
Equal highs and lows often exist to attract stop losses.
When structure breaks violently, it is often after liquidity has been collected.
Understanding this reduces emotional trading and FOMO.
Common Market Structure Mistakes
1. Forcing Structure
Seeing trends where none exist.
2. Trading Against the Trend
Ego-driven countertrend trades.
3. Ignoring Context
Structure without higher timeframe bias is incomplete.
4. Overcomplicating
Market structure is simple—traders make it complex.
Market Structure and Trading Psychology
Market structure removes emotion because it provides clarity.
When you know:
-
The trend
-
The key highs and lows
-
Where structure breaks
You stop guessing.
Trading becomes execution—not hope.
How to Practice Market Structure
-
Strip your chart clean
-
Mark highs and lows
-
Identify trend condition
-
Wait for structure confirmation
-
Journal screenshots daily
Consistency beats complexity.
Final Thoughts: Master Structure Before Strategy
Market structure is not a strategy—it is the language of the market.
If you cannot read structure:
-
Indicators will confuse you
-
Entries will feel random
-
Losses will feel unfair
But once you understand it, price action becomes logical.
Structure first. Entries second. Profits last.
Disclaimer: This content is for educational purposes only and does not constitute financial advice.